
Financial markets analysis
Currency calendar
Economic data releases and MPC
meeting dates
Economic forecasts
21 November
2011
Business
Banking sales desk
(011)
535 4003
Corporate
sales desk
JHB
(011) 535 4002; DBN (031) 327 3000; CTN (021) 413 9300
Institutional
sales and marketing desk
(011)
535 4005
Derivative
sales and structuring
(011)
535 4021
Nedbank
Ian
Cruickshanks
(011) 295 8640
Tasnim Rawat
(011)
294 3744
Contents
Rand prospects: Possible Greek sovereign debt default
spreads contagion fears through European Union
Financial markets analysis: EU peripheral sovereign
debt collapse pushes fund flows to safe-havens
Currency calendar: Rand posts widespread depreciation
as risk appetite reverses
Economic data releases and MPC meeting dates
Nedbank
facts and forecasts
Rand
prospects:
In
last month’s Rand Prospects we highlighted how critical the next few months
would be for how the crisis in the Euro Zone evolves. We argued that markets would experience
significant volatility, as investors digested new economic news and assessed
the plans to resolve the European debt crisis.
The past month, but particularly the past few days, have been marred by
significant volatility with the rand falling by 5,4%, 2,9% and 5% against the
US dollar, euro and the British pound since mid-October.
This
is not surprising as the past month has yielded little in the form of decisive
action on the part of the policymakers to resolve the crisis. Most importantly, the European Central Bank
(ECB) is still unwilling to act as the lender of last resort by purchasing
sovereign bonds, in a move that now seems the only viable way to stop the
upward march of bond yields across the Euro Zone and calm global markets.
The
much anticipated G20 meeting in Cannes proved to be unexciting, with nothing
new being agreed to resolve the debt crisis.
The G20 concluded their meeting by welcoming the Euro Zone’s
“comprehensive plan” and urged “rapid elaboration and implementation, including
of country reforms.” The leaders
committed to ensuring that “the IMF continues to have resources to play its
systemic role”. Further details on
expanding the financial firepower of the IMF still need to be worked out, with
finance ministers expected to report back on their findings by early 2012.
While economic
policy has failed to deliver anything exciting, Europe’s political landscape
has experienced a shakeup. The
governments of both Italy and Greece have been removed, with the hope of
replacing them with more competent technocratic leadership that would help to
restore confidence in the two beleaguered countries.
Chart 1 : European bond yields continue to
rise |
|
|
|
Source: DataStream |
Silvio Berlusconi, the Italian
Prime Minister, resigned over the weekend.
Pressure has been building on his government to come up with a credible
solution to Italy’s debt burden – the second highest in Europe - as bond yields
shot to their highest level on record during the week. Berlusconi has been replaced by Mario Monti,
a former EU Commissioner and Professor of Economics. Although there have been calls for an early
election, it seems more likely that the authorities will focus on restoring
confidence with €200 billion of debt maturing by the end of next April. Earlier last week, the Greek parliament
elected Lucas Papademos, a former
vice-president of the European Central Bank, to head an interim government,
which must implement a new international bail-out and take the country to early
elections in February 2012.
The
reshuffling of European politicians (and the expanded European Financial
Stability Fund) will do little more than temporarily calm the markets. We have argued on numerous occasions that any
plan needs to have two components.
First, to ensure that Greece’s public finances are sustainable. The current proposal, where private investors
take a 50% haircut does not adequately address Greece’s insolvency, even with
these measures government debt to GDP will be around 120% of GDP by the end of
the decade. The second component is to
address liquidity concerns, which centre on fears that troubled governments may
not be able to roll over their debt. The
unwillingness of the European Central Bank (ECB) to act as lender of last
resort is a big stumbling block in any plans to address illiquidity within the
Euro Zone.
The European
debt crisis is not the only challenge global markets face. The currency wars appear to be
heating up, particularly between the US and China over the sustained
undervaluation of the renminbi, which is believed to give China an unfair
advantage in international trade. In a
move aimed squarely at China, the US Senate has recently passed a bill to penalise
countries that manipulate their exchange rates.
The IMF also recently entered the
fray. The Fund argued that the Chinese
financial system faced “a steady build up of vulnerabilities, particularly in
the property market, that require the government to relax its grip on banks,
the exchange rate and interest rates”.
The IMF said that one of the most important early reforms was to allow a
more flexible exchange rate.
With fiscal
sustainability under the spotlight globally, the local market got a sharp
reminder that a lapse in fiscal policy at home would have negative
consequences. Moody’s decision to change
South Africa’s outlook from “stable” to “negative” comes as a clear warning to
the authorities that they cannot rest on the laurels of past successes and need
to continue to maintain sound economic policy.
Moody’s noted that increasing demands from within the ruling ANC party
and its political partners to step up fiscal easing is problematic given the
roughly 15 percentage point rise that has already occurred in the government's
debt to gdp ratio over the past three years.
With 28% of South Africa’s sovereign bond market held by foreigners, the
country remains very vulnerable to any change in investors’ sentiment about the
sustainability of government finances.
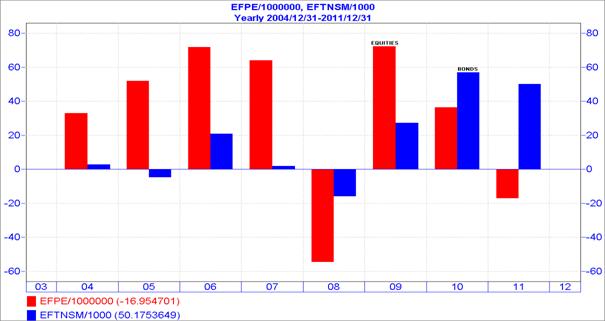
Chart 2 : Foreign inflows into equities and
bonds |
|
|
|
Source: I-Net |
Given
the current uncertainty and heightened volatility, there are three possible
outcomes for the rand.
In
the first scenario, the crisis in the Euro Zone escalates and results in a
larger correction in the rand and asset prices in general. A double-dip recession in Europe, combined
with a full-blown debt crisis could well tip markets over the edge. Policy missteps at home, in an environment of
heightened risk aversion, could also contribute towards a steep depreciation in
the currency.
In
the second scenario, the stop-start growth of the past two years continues and
European policymakers continue to muddle along.
With growth in advanced economies broadly stagnating, investors will be
drawn to the higher yields offered by emerging markets. In this scenario, the rand will retrace its losses
and will settle somewhere below R7 to the dollar over the coming months.
A
combination of both these scenarios is not out of the question either. The currency could well consolidate and
recover in the coming weeks, as investors focus on the good rather than the bad
news in the short term. However, with no
meaningful solution insight for the European debt crisis, the rand could
continue its volatile trend into the New Year.
Conclusion
Much
now depends on how the crisis in Europe unfolds. If some level of confidence is restored,
growth will be slow but steady and the rand would gain as investors looked to
take advantage of the higher yields on offer.
However, if the crisis continues to fester without a real solution, the
rand will remain weak and volatile, with a significant risk the rand collapses
along with other riskier assets.
Table 1 : Influences on the rand |
|||||||||||||||||||||||||||||||||||||||||||||||||||||||||||||||||
Nedbank
Group Economic Unit
Financial
markets analysis: EU peripheral
sovereign debt collapse pushes fund flows to safe-havens
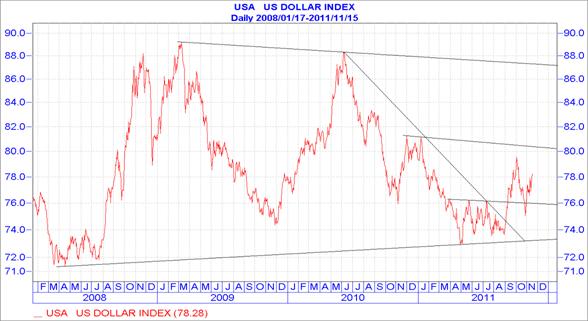
Safe-haven demand for US treasuries buoys dollar
index
Source: I-Net,
Nedbank
l
The US dollar
index measures the dollar against a basket of currencies of major US trading
partners weighted according to value of trade.
l
US treasuries have
maintained their safe-haven status while European sovereign debt woes have
spread from Greece to larger members – Portugal, Spain, Italy and even France.
Their government bond yield spreads against EU benchmark Germany have widened
to levels not seen since euro convergence in the late 1990s (see table page 9).
Greece is closest to default with 3-year sovereign bond yields at an
unaffordable 80%.
l
This scenario has
supported investment demand for the USD, pushing the index above the medium
term declining trend line (June 2010 /August 2011). A sustained move beyond the
recent upside break above the support line across the March/July highs at 76
index points would confirm a likely longer-lasting period of USD relative
strength. This could continue towards the upper resistance line across the
November 2010/January 2011 highs at 81 index points, about 4% above the present
level and similar to the strong bounce in November 2010 from around the same
base level.
l
Renewed volatility
across all financial markets, reducing global investors’ risk appetite,
exacerbating the move to safe-havens as capital preservation becomes asset
managers’ first aim. With a dearth of alternative investment destinations of
similar size, US treasuries have maintained their investment appeal even as
yields fell to record lows, contributing to the dollar index support.
l
Safe haven demand for
US treasuries is supporting foreign capital inflows buoying the USD.
l
The present
determination of the Federal Reserve to maintain or possibly increase US money
supply (M2 +10.1% y/y in September) should support expectations for further USD
depreciation over the longer term after the present rally. This could extend
into 2012 as the length of the average cycle varies between 6 and 14 months,
with the present move having extended for only 2 months.
l
A longer-term weaker
USD, which would be indicated by a turnaround in the dollar index, should
eventually support an export-led US recovery. However, this is not expected within
the near future.
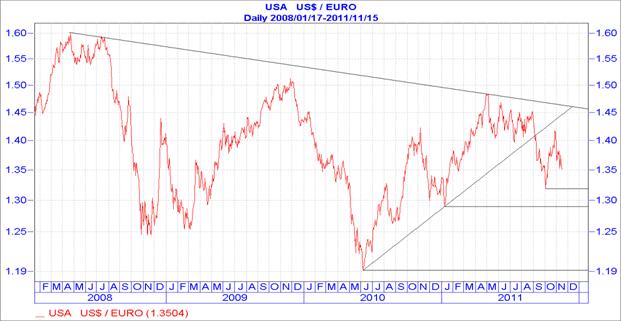
Euro slumps as EU sovereign funding crisis
intensifies
Source: I-Net,
Nedbank
l
Fears of
sovereign debt contagion from the PIIGS group (Portugal, Italy, Ireland,
Greece, Spain) to the banking sector of major EU members, pulled the euro below
the base line of its 5 month consolidating pattern (April/ August) to a daily
closing low of USD1.32/EUR.
l
This is the
first support from which there was a bounce after the early September break
down, as the ECB announced the deployment of short-term liquidity measures to
bolster European banks, whose funding was restricted by reduced access to USD
funding sources.
l
However, the
break below the 2010/2011 rising trend line indicates likely sustained
depreciating pressure remaining on the euro. A further decline below USD1.32/EUR could develop by year-end towards the next lower
support line across the January daily closing low at USD1.29/EUR.
l
EU banks
remain over-exposed to peripheral members’ sovereign debt, as they have to mark
values to market basis which could be as little as 25% of nominal value
resulting in significant write-offs in asset value. This could leave them in
breach of governing regulations on risk and capital requirements, possibly
needing additional capital injections which will be difficult to raise in the current
tight liquidity environment.
l
Their ability
to finance new credit could also be restricted, slowing the region’s economic
recovery potential. This would also have a negative impact on SA’s
international trade pattern and volume as the EU is SA’s most important trading
bloc partner.
l
The worsening
funding and credit status of French banks resulted in Moody’s International
rating agency downgrading European banking giants, Societe Generale, Credit
Agricole and BNP Paribas.
l
The sovereign
debt crisis amongst peripheral members of the European Union (PIIGS group - Portugal,
Italy, Ireland, Greece and Spain) has pushed their government bonds to record
high yields, reflecting their increased credit risk as the Greek 3-year
sovereign bond yield soared to an unsustainable 80% this month.
l
The spreads
between the yields on European peripheral members’ 10-year bonds and German
bunds have widened substantially, remaining at unsustainable levels (see table
below) threatening a debt trap, where debt servicing costs exceed government
revenue, among some members of the PIIGS group. Ratings agencies further downgrading
Greece, Spain, Portugal, Italy and Ireland’s credit ratings as well as
escalating concerns over Italy’s sovereign debt sustainability (government debt
120% of GDP) and political instability, have added to concern over sovereign
debt in the region.
|
|
October 2011 |
November 2011 |
Peak |
|
Greece |
3188
basis points |
3188bp |
3188bp (Nov 2011) |
|
Ireland |
160bp |
639bp |
1193bp (July 2011) |
|
Portugal |
71bp |
974bp |
1065bp (July 2011) |
|
Spain |
64bp |
454bp |
457bp (Nov 2011) |
|
Italy |
96bp |
518bp |
557bp (Nov 2011) |
|
France |
29bp |
185bp |
185bp (Nov 2011) |
l
The historic
correlation between the euro and rand exchange rates against the US dollar, suggests
that a weaker euro would add negative pressure onto the rand exchange rate.
Japanese
yen maintains gains on safe-haven status despite BOJ intervention
Source: I-Net,
Nedbank
l
Forex market intervention
by the Bank of Japan has proved ineffective in stemming the strong appreciating
cycle in the Japanese yen, retaining its 4-year strengthening trend, remaining
around its record strongest level.
l
Short-term
corrections have invariably been met with renewed demand, which appears likely
to continue, as the technical picture indicates a likely continuation of the 3
months pattern of declining highs and lows below the July breakdown.
l
Record low Japanese
interest rates are buoying the carry trade, where funds are moved from low
interest rate currencies like the yen to higher yielding emerging market bonds.
l
This supported demand
for RSA bonds until September 2011 on wide positive interest rate differential,
adding to support for the rand exchange rate and liquidity in domestic
financial markets, while contributing to a lower cost of government funding,
reducing drawdowns on domestic funding sources.
l
However, the recent
turnaround in risk appetite has temporarily interrupted these flows (see page 22),
negatively impacting SA bond yields and the rand exchange rate.
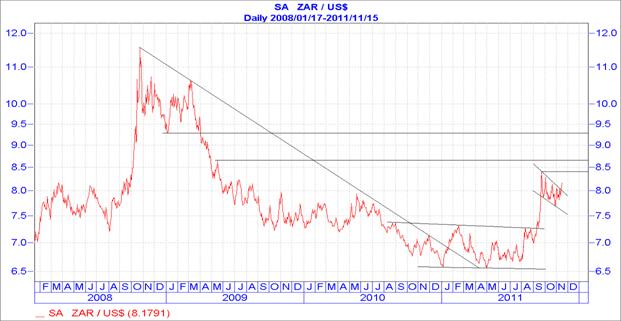
Rand
renews weakening trend against US dollar as global risk appetite reverses
Source: I-Net,
Nedbank
l
The reversal of
global risk appetite, leading to a withdrawal of international investor funds
from equities into safe haven US treasuries and gold, has intensified depreciating
pressure on the rand.
l
The rand has made a
significant break away from its long-term appreciating cycle (2008/2010),
followed by its medium-term base consolidating formation (2011) and a steep
depreciating spike to a weakest R8.45/USD before returning to the current test
of the pivotal level around R7.80/USD to R7.90/USD.
l
However, recent
upheavals in the euro have rippled through to higher risk EM currencies,
pushing the ZAR above the upper trend line of the 2-month
declining/strengthening range.
l
The surge above the
recent breakout level at R8.00/USD could introduce a new weaker range,
initially extending to the September weakest level at R8.40/USD, with potential
to move towards the next rand support level at R8.60/USD.
l
Sustained global
currency uncertainty, possibly sparked by changes in membership of the European
Union, could spark an intensification of risk aversion, pushing the rand
towards the weakest rand support level around R9.30/USD over the medium-term.
l
Renewed speculation
on a double-dip recession in the Euro Zone and UK has diminished expectations
for robust growth in commodity based emerging markets.
l
This has raised fears
of declining SA exports, rippling through to a negative impact on the trade and
current account deficits, leading to further rand depreciation over the
medium-term.
l
This will have a
serious impact on pushing up producer and consumer inflation. SARB Governor
Marcus recently warned that rand depreciation would be the biggest inflation
threat facing SA.
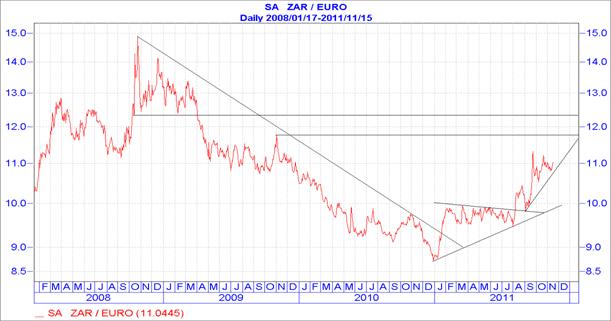
Rand weakens against euro, despite EU funding
challenges
Source: I-Net,
Nedbank
l
The rand reversed its
long term appreciating trend (2008/2010) against the euro in January 2011,
breaking above the declining trend line of its 27 month cycle before
consolidating in a narrow range between R9.50/EUR and R10.00/EUR.
l
A surge in risk
aversion led to a sell-off in emerging market currencies against global reserve
currencies, pushing the rand above the February/July consolidating pattern.
This was followed by a higher/weaker trading range, with the previous ceiling
at R10.00/EUR reverting to a floor for a new weaker trading range, which
extended to R11.35/EUR where a rally soon corrected its temporarily oversold
status.
l
A new range is
developing, remaining above the short-term interim rising trend line
(September/ November) with the short-term pattern indicating potential for
further losses towards the next higher support line around R11.77/EUR.
l
The current EU
sovereign debt and bank funding crises have held the euro in a weaker trading
range below the more buoyant levels seen in 2011/H1. However, the reversal in
global investor risk appetite has held the rand around its weakest levels
(September/ November) since late 2009.
l
This could have a
significant impact on SA foreign trade as the Euro Zone is SA’s major
international trading bloc partner, risking higher imported input costs on
producer and consumer inflation, which would be partially offset on the trade
account with higher export earnings in rand terms.
Rand maintains weaker range against British pound
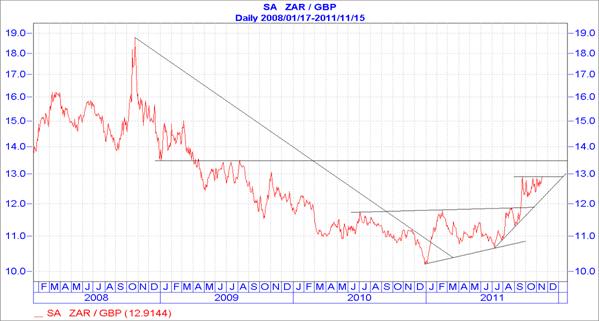
Source: I-Net,
Nedbank
l
Since the rand broke
above the ceiling of the previous trading range at R11.90/GBP, this level has
reverted to a floor for a new weaker range, which could extend towards the
upper support line across the June/August 2009 weakest levels at R13.50/GBP.
l
The UK economy has failed
to rebound strongly from the 2008/09 recession, extending fragile economic
activity and low confidence outlook into 2011/2012, while economic growth
prospects remain weak on a deteriorating global economic outlook and aggressive
UK government budget austerity measures, likely delaying monetary policy
tightening, limiting gains in the British pound, slowing the weakening GBP/ZAR
trend.
l
A temporary support
ceiling has formed around R12.90/GBP, which is currently being challenged
(September/ November). A break above this level would support expectations for
the weaker trend to extend towards R13.50/GBP.
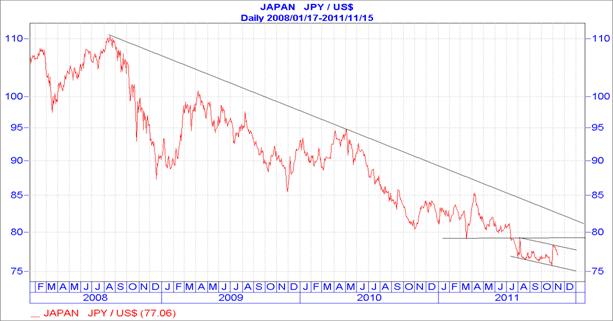
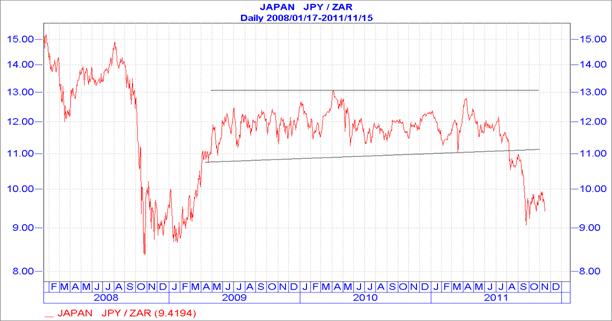
Rand weakness
against Japanese yen threatens higher SA producer input costs, rippling through
to higher consumer inflation
Source: I-Net,
Nedbank
l
The rand has made a
decisive break below the 2009/2011 consolidating pattern between JPY11.0/ZAR
and JPY13.0/ZAR, with the minor recovery in August and subsequent fall being a classic
“goodbye kiss”, supporting the establishment of a weaker range between
JPY9.0/ZAR and JPY11.0/ZAR.
l
Low Japanese interest
rates facilitated the attraction of carry trade investments into higher
yielding emerging market assets, benefiting foreign portfolio inflows into RSA
bonds, inflating domestic liquidity, supporting the rand. However, a subsequent
decline in risk appetite sparked a reversal of investment funds from the rand
arena and a turnaround in recent declining bond yields, risking an increase in the
cost of government funding.
l
Relative rand
stability anchored the cost of imported Japanese goods between April 2009 and
July 2011, having a stabilising impact on SA’s motor industry, improving that
sector’s export prospects, after imports of vehicle manufacturing inputs
suffered massive price distortions in 2006/2008 when the rand plunged from JPY
19.60/ZAR to JPY 8.40/ZAR within a 2½ year period, placing huge pressure on
imported input prices and manufacturers’ profit margins. Recent currency
movements risk another adverse change to this relationship.
l
This will buoy
producer inflation, rippling through to higher consumer prices over the
medium-to longer-term. In this scenario the SARB is unlikely to cut interest
rates again in the current cycle despite the fragile domestic and global
economies.
l
The yen is taken as a
proxy for the currencies of China and South-East Asia, although SA’s imports
from the region are dollar-denominated. China has grown to be SA’s largest
single country trading partner, emphasising its growing importance to the
African continent, as it strives to obtain long-term base commodity resources
to satisfy its voracious resource appetite to sustain its aim to maintain an
8-10% annual GDP growth rate, while transforming from an agrarian led economy
to a modern industrialised consumer driven society. Chinese monetary policy has
been tightened over the past year, as the Authorities struggled to rein in
rampant speculative activity in equities and property and to control rising
inflation from excessive credit creation.
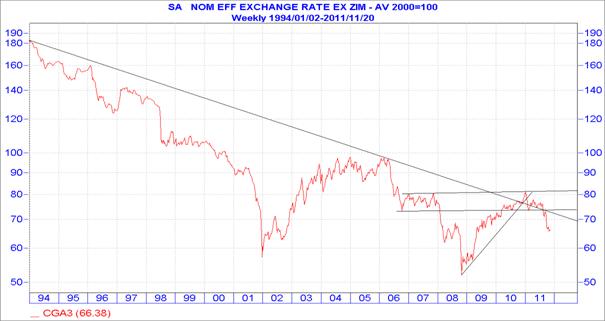
Rand nominal effective exchange rate (NEER) plunges below long-term
support levels
Source: I-Net,
Nedbank
l
The NEER measures the
rand against a basket of currencies of SA’s major trading partners weighted
according to value of trade.
l
The index has
reversed its recovering trend (2009/2011) plunging below the long-term
declining trend line (1994/2011), while also falling below the consolidating
pattern established in 2007 and 2010/2011 between 73 and 81 index points.
l
The sustained move
below these levels supports expectations for medium-to longer-term rand
weakness.
l
This will buoy SA
export earnings in rand terms, but reinforce higher imported producer input
prices, rippling through to higher consumer inflation, negatively impacting
SA’s competitiveness over the longer-term, slowing economic growth and job
creation.
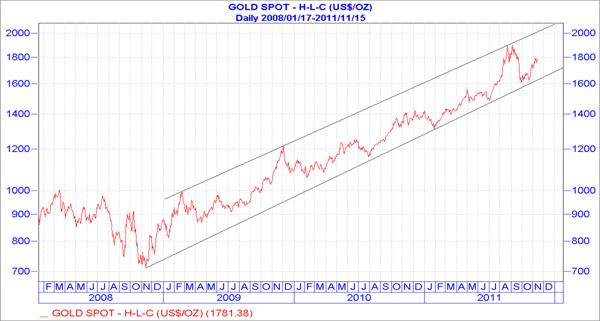
Gold renews long-term
rising cycle
Source: I-Net,
Nedbank
l
Heightened concerns
over the spreading European sovereign debt crisis, worries over a double-dip EU
recession, while the US lost its AAA credit rating and indications the economic
recovery in developed economies may be stalling, increased investor anxiety and
pushed the gold price to an intra-day record high at $1921/oz in September on
demand for the “ultimate” currency hedge.
l
While the
long-term rising cycle (2009/2011) remains intact, the current pullback from
the double-top reversal pattern (August/September) and decline below the steep short-term
rising trend line (July/September), indicates the development of some
consolidation within the top trading range between $1600/oz and $1900/oz.
l
The rand gold price hit
a fresh peak at R14684/oz on 21 September, buoying export earnings, supporting
the trade and current accounts, while contributing to some support for the rand
exchange rate, however,
these gains have been partially offset by the miners’ strike, safety related
stoppages and operational setbacks.
l
Currency
volatility and escalating uncertainty over central bank interventions should
maintain demand for gold as the ultimate currency and inflation hedge. This
could extend the lives of SA’s low grade, high cost gold mines, reinvigorating
a “sunset industry”, buoying SA export earnings, slowing the trade and current
account deficits and the rand’s weakening tendency.
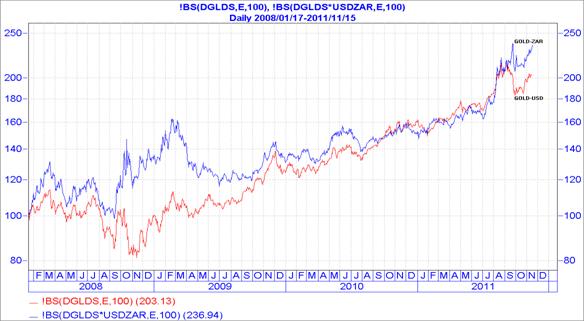
Rand weakness
supports gold industry earnings
Source: I-Net
l
Despite strong rand
appreciation against the USD over the past 4 years, the gold price in rand
terms has performed similarly to the gold price measured in dollars, while the
recent rand pullback has provided a further boost to producers’ revenue
streams.
l
The 2011 reversal of
the rand’s 2-year appreciating trend has added further to miners’ revenue
gains, benefiting the trade and current accounts, possibly slowing the rand’s
weakening tendency.
l
However, renewed rand
relative strength would offset the gains from the higher bullion price which
the industry desperately needs as it reels under the increasing challenge of
high costs, diminishing ore grades, scarcity of suitably qualified miners and
strike action to support demands for ever increasing wages, with no counter-balance
in labour productivity, reducing profitability and the industry’s contribution
to the fiscus (tax take).
l
These factors have
exacerbated the challenge of mining at ever-deepening depths forcing mining
companies to consider automated mining techniques, limiting job creation and
poverty alleviation, with the existing base employee group supporting on
average between 5 to 10 direct and extended family dependants.
l
This will force
government to extend social grants to a wider group, absorbing a greater share
of government’s revenue, slowing capital allocations to infrastructure
development while deferring a robust investment-led broad economic recovery.
Oil price stabilises in
lower range as EU economic prospects stagnate
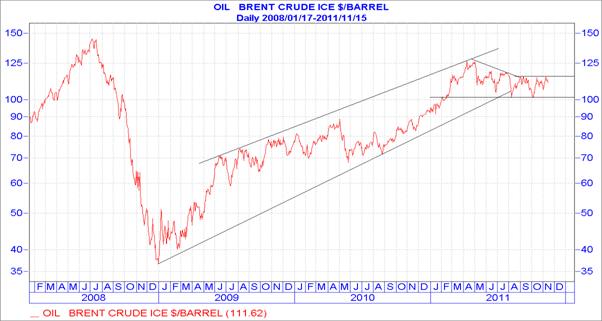
Source: I-Net,
Nedbank
l
Since the Libyan
political dispute concluded, expectations for renewed oil supplies have risen
(estimated 2012 production +1mn barrels per day), while the economic outlook
deteriorates reducing oil demand estimates, the spot price of Brent crude oil
has settled in a narrow range between $101/barrel and $115/b.
l
OPEC are considering
cutting production, reducing supplies to the market despite the onset of
Northern hemisphere winter accompanied by high demand for heating oil, after
the US summer time driving season saw the lowest gasoline demand in 8 years.
l
The break below the
lower trend line of the primary rising cycle (2009/2011) indicates a possible
directional change, while temporary support is provided by the horizontal
support line across the August/October lows at $101/b.
l
A continuation of the
current sideways pattern is expected to continue in the short-term, with
possible downside risk if the current EU debt crisis leads to a wider economic
slowdown, negatively impacting fuel demand.
Commodity price cycle leads
rand exchange rate
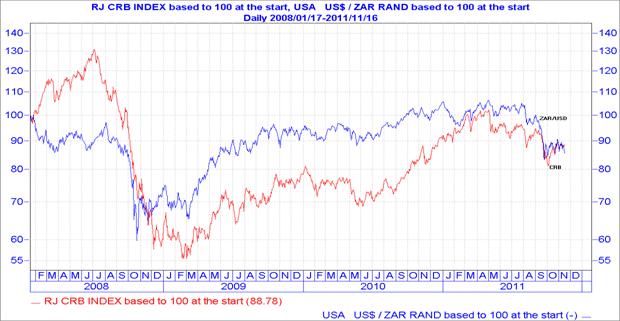
Source: I-Net
l
Base commodity prices
lead the SA economic cycle, as SA remains a major producer of precious metals
(platinum and gold) and industrial commodities (coal, iron ore), resulting in a
fair correlation between commodity prices and the rand exchange rate.
l
Expectations for a
further decline in industrial commodity prices as the developed world economies
renew their slide towards a potential double-dip recession, reversing previous
strong demand estimates, support expectations for a gradual weakening in the
dollar/rand exchange rate over the medium-to longer-term.
Rand depreciation reverses, benefit from weaker oil price on SA
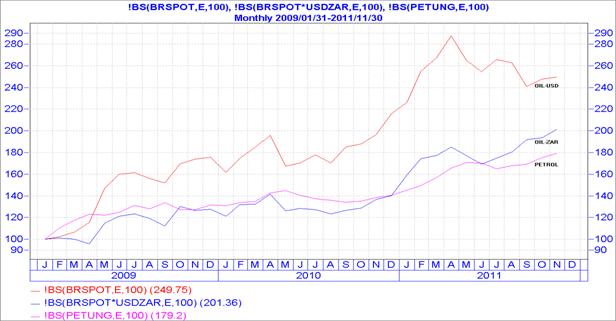
Source: I-Net
l
Oil, SA’s major
import, is priced in dollars, making domestic fuel costs susceptible to the
dollar/rand exchange rate.
l
Volatility in the oil
price and the dollar/rand exchange rate have led to swings in the imported cost
of oil and significant fluctuations in domestic fuel prices, having a
considerable impact on producer and consumer inflation.
l
SA domestic fuel
prices benefited from rand appreciation between January 2009 (R9.50/USD) and April
2011 (R6.55/USD), slowing the impact of the higher oil price. The dollar oil
price is up 149.8% since January 2009 while the rand oil price has risen
101.4%, slowing the petrol price increase to 79.2%.
l
The benefit from the
rand’s strengthening bias against the USD over this period has partially
protected SA from much higher domestic fuel prices. However, the current weaker
trend in the rand is minimising the previous benefit, raising the risk of
higher producer and consumer inflation.
l
This supports the
view that SA cannot afford a weak currency as domestic inflation accelerates on
the back of rand depreciation, a risk currently developing as global risk
aversion reverses the rand’s previous appreciating/ consolidating trends.
l
Despite increased
rand earnings on more competitively priced exports arising from a weaker
currency, the higher cost of new fixed investment and rising imported input
prices would quickly offset the temporary gains in export earnings. This could
place SA on a treacherous path of further rand depreciation, declining economic
activity and job losses, undoing the benefits hard won over the past 17 years
through responsible fiscal and monetary policies.
Nedbank fuel hedging
product
l
To protect heavy fuel
consumers against unexpected fuel price volatility, Nedbank has a unique hedging
product stabilising the rand cost of fuel, which can be accessed through
Nedbank Global Markets Business Banking (+2711 535 4003) and Corporate Sales
Desk (+2711 535 4002).
JSE
All Share Index (ALSI) tracks international equity markets lower on faltering
risk appetite and weakening economic prospects
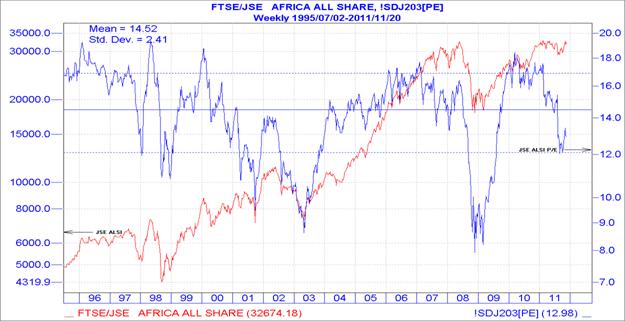
Source: I-Net
l
The JSE ALSI hit an
intra-day record high at 33334.55 on 14 February 2011 led by resource stocks
amid rising commodity prices, with supply constraints and rising demand pushing
up prices.
l
Subsequently the JSE
ALSI pulled back with cautious investors succumbing to profit-taking as the
previous record high in 2008 was set in an environment of domestic economic growth expectations of 5%-6%,
while forecasts for 2011 GDP growth are more moderate at around 3%. In
addition, risk aversion has increased on heightened uncertainty about local and
global economic recovery prospects and jitters over the unresolved EU sovereign
debt and bank recapitalisation crises, while the reversal in precious metals
and industrial commodity prices has intensified gloomier corporate profit
expectations.
l
This has
pushed the average P/E ratio from 17.50 in February to the present 12.98 (on
historic earnings), close to the lowest since July 2009, moving below the long-term
mean of 14.52 on declining expectations for growth in corporate profits in a
slowing economic environment.
l
This analysis
suggests a cautious approach towards the allocation of additional investment
funds to equities, possibly slowing foreign capital inflows to the JSE and their
benefit to the rand exchange rate (see analysis page 22).
Foreign portfolio inflows to SA bonds
offset outflows from SA equities
Source: I-Net
l
Net foreign trades in
equities are shown in the red bars while foreign bond trades are shown in the
blue bars.
l
There was some
bargain hunting by foreign investors in equities on the JSE and for RSA bonds
in the first week of October, but these were not significant quantities.
l
Declining foreign
portfolio inflows could increase pressure on National Treasury to fund the
current account deficit through increased offers at their weekly bond auctions.
l
This could add to
upside pressure on RSA bond yields in the short-to medium-term.
Currency
calendar: Rand posts widespread
depreciation as risk appetite reverses
The graph
below shows the appreciation or depreciation of the rand daily closing exchange
rate on a percentage basis over the past month (between 14 October and 15
November) and in the year-to-date (ytd) (3 January to 15 November) against
major currencies, with depreciation shown below the 0% line and appreciation
above. Over the past month the rand posted a widespread depreciation against
major currencies, led by losses against the Japanese yen (-4.61%), the British
pound (-4.35%) and US dollar (-4.34%) as investor risk appetite was dented on
worries over the worsening EU sovereign debt crisis and deteriorating global
economic prospects, limiting demand for higher yielding currencies. This
exacerbated the rand’s ytd losses, pushing the local unit down 25% to 30%
against major currencies, led by losses against the safe-haven yen (-32.1%),
British pound (-26.44%) and the US dollar (-2.42%).
Source: Bloomberg
The graph
below summaries the dollar’s appreciation or depreciation against other major
currencies over the past month (between 14 October and 15 November) and in 2011
ytd. Over the past month the dollar mostly appreciated against major
currencies, supported by safe-haven inflows into US treasuries as global risk
appetite remained volatile amid concern over the unresolved European sovereign
debt crisis and the risk of contagion rippling through the global economy and
the systemic risk it poses on the world financial system. Gains were led
against the rand (+4.16%) and the Swiss franc (+2.57%), but limited against the
yen (-0.25%) as risk appetite improved on hopes that policymakers would take
bold steps to tackle the debt crisis. In the ytd the dollar extended its
appreciation trend against most major currencies, led by gains against the rand
(+19.62%) and Swiss franc (+1.68%). However, the dollar lost ground against the
Japanese yen in the ytd (-6.16%) following intervention in the foreign exchange
market by the Bank of Japan at the end of October.
Source: Bloomberg
The graph
below summaries the appreciation or depreciation of emerging market currencies
against the US dollar over the past month (since 14 October) and in the 2011
year-to-date. In the past month and in the ytd emerging market currencies extended
their depreciating trend against the dollar, as the deepening European
sovereign debt crisis maintained choppy risk appetite, prompting investors to
shift out of emerging markets and move into the safe-haven of US treasuries. The
Hungarian forint (-9.7%) and the Czech koruna (-6.13%) were the worst
performers on a monthly basis, while the rand (-19.1%) and the Turkish lira
(-13.6%) were the hardest hit in the year-to-date, despite attempts by the
Turkish Central Bank to strengthen its currency.
Source: I-Net
Ian Cruickshanks
Nedbank Treasury Strategic Research
Economic data releases and MPC meeting
dates
Economic data releases
|
Date |
Time |
Indicator |
Period |
Previous |
|
22
November |
09:00 |
SA leading
indicator |
September |
130.7 |
|
23
November |
10:00 |
CPI (m/m) |
October |
0.4% |
|
23
November |
10:00 |
CPI (y/y) |
October |
5.7% |
|
24
November |
11:30 |
PPI (m/m) |
October |
-3.3% |
|
24
November |
11:30 |
PPI (y/y) |
October |
10.5% |
|
29
November |
08:00 |
Private Sector Credit
(y/y) |
October |
5.47% |
|
29
November |
08:00 |
M3 Money Supply
(y/y) |
October |
6.80% |
|
30 November |
11:30 |
SA GDP (q/q) |
Q3 |
1.3% |
|
30
November |
14:00 |
South Africa
Budget |
October |
-R17.01B |
|
30
November |
14:00 |
Trade Balance |
September |
-R2.5B |
|
30
November |
11:00 |
Kagiso PMI |
November |
50.5 |
|
01 December |
08:00 |
Net Reserves |
November |
$49.22B |
|
01 December |
08:00 |
Gross Reserves |
November |
$59.35B |
|
07 December |
11:00 |
Vehicle sales |
November |
18.9% |
|
12
December |
13:00 |
SACCI business
confidence |
November |
97.5 |
Source:
Bloomberg
Nedbank Economic
facts and forecasts
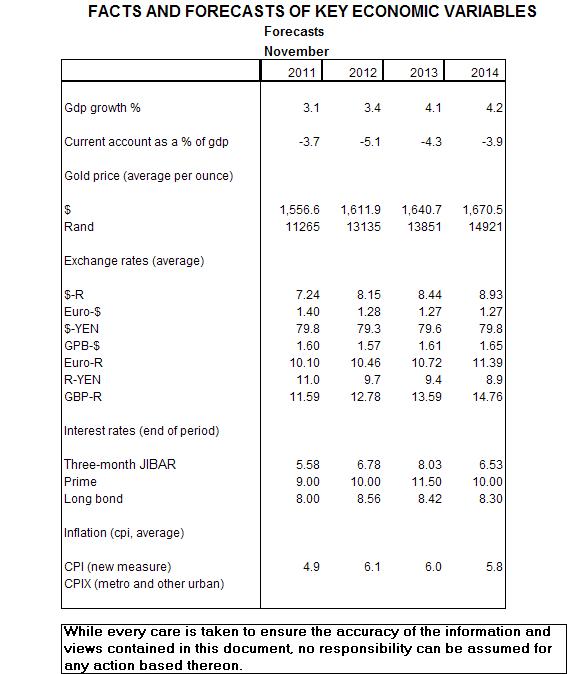
Source:
Nedbank Group Economics Unit
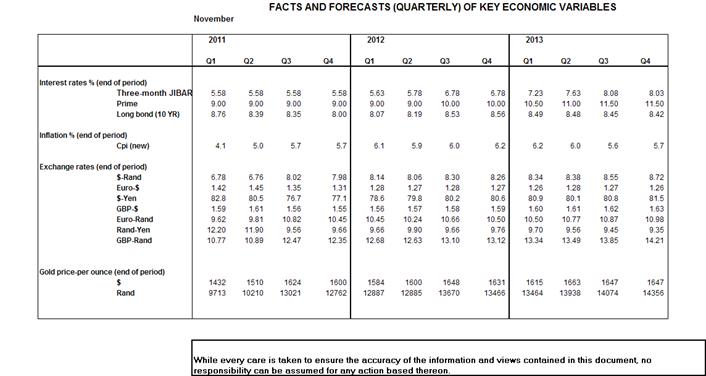
Source:
Nedbank Group Economics Unit
Reports
produced by Nedbank Treasury Strategic Research
Daily market and economic comment
Monthly currency insights
Monthly interest rate insights
To receive any of these publications
or to request alternative financial market data and analysis, please contact:
Ian Cruickshanks (+27 11) 295-8640 iancr@nedbankcapital.co.za
Michelle Pingo-de
Abreu (+27 11) 294-1753 michellep@nedbankcapital.co.za
Tasnim Rawat (+27
11) 294-3744 tasnimr@nedbankcapital.co.za